Dive into the world of high-volume Exchange-Traded Funds (ETFs). Understanding the dynamics of the top traded ETF is crucial for any serious investor. This guide not only lists the current most active ETFs but also explains why they are market leaders and how you can leverage this information for your investment strategy. We will explore the significance of trading volume, assets under management (AUM), and liquidity to help you identify robust investment opportunities.
Table of Contents
What are the Most Actively Traded ETFs Today?
The landscape of actively traded ETFs is dominated by funds that track major market indices. These ETFs serve as the backbone for countless institutional and retail portfolios, leading to immense daily trading volumes and substantial assets under management. Below, we examine the leaders through these two critical lenses.
Top ETFs by Average Daily Trading Volume
High daily trading volume is a hallmark of liquidity, indicating that a large number of shares are bought and sold each day. This typically results in tighter bid-ask spreads, reducing transactional costs for investors. Here are the perennial leaders in this category.
| Ticker | ETF Name | Primary Index/Asset | Average Daily Volume (Illustrative) |
|---|---|---|---|
| SPY | SPDR S&P 500 ETF Trust | S&P 500 | ~75 Million Shares |
| QQQ | Invesco QQQ Trust | Nasdaq-100 | ~55 Million Shares |
| IWM | iShares Russell 2000 ETF | Russell 2000 | ~30 Million Shares |
| EEM | iShares MSCI Emerging Markets ETF | MSCI Emerging Markets Index | ~25 Million Shares |
| GLD | SPDR Gold Shares | Spot Gold Price | ~20 Million Shares |
Top ETFs by Assets Under Management (AUM)
AUM represents the total market value of all the shares of an ETF. A high AUM signifies investor confidence, stability, and often, a long and successful track record. These funds are the titans of the industry.
| Ticker | ETF Name | Primary Index/Asset | AUM (Illustrative) |
|---|---|---|---|
| SPY | SPDR S&P 500 ETF Trust | S&P 500 | ~$510 Billion |
| IVV | iShares CORE S&P 500 ETF | S&P 500 | ~$480 Billion |
| VTI | Vanguard Total Stock Market ETF | CRSP US Total Market Index | ~$450 Billion |
| VOO | Vanguard S&P 500 ETF | S&P 500 | ~$440 Billion |
| QQQ | Invesco QQQ Trust | Nasdaq-100 | ~$250 Billion |
Analysis: What Common Themes Do We See in the Top Lists?
The most prominent theme is the dominance of broad-market index funds, particularly those tracking the S&P 500. ETFs like SPY, IVV, and VOO appear on both lists, underscoring their central role in the market. This indicates that investors prioritize liquidity, low costs, and exposure to the U.S. economy’s blue-chip companies. Another key theme is the prevalence of ETFs tracking the tech-heavy Nasdaq-100 (QQQ), reflecting the sector’s long-term growth appeal.
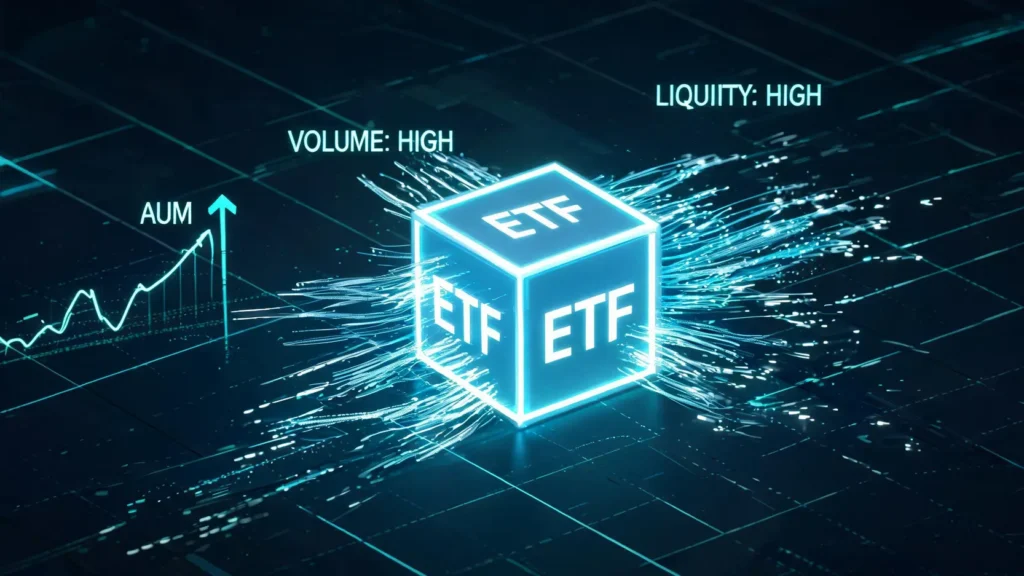
Decoding the Metrics: Trading Volume vs. AUM vs. Liquidity
While often related, these three metrics—volume, AUM, and liquidity—tell different stories about an ETF’s character and suitability for your portfolio. Understanding their nuances is key to making informed decisions.
Why High Trading Volume is Crucial for Investors (Bid-Ask Spreads)
High trading volume is a direct indicator of market interest. For an investor, its primary benefit is a narrow bid-ask spread. This is the difference between the highest price a buyer is willing to pay (bid) and the lowest price a seller is willing to accept (ask). A tight spread means lower transaction costs and less market friction when entering or exiting a position, which is particularly vital for active traders.
What High AUM Signifies (Stability & Trust)
A large asset base, or AUM, is a vote of confidence from the market. It suggests that a fund is well-established, trusted by a large number of investors, and economically viable for the issuer to maintain. High AUM often correlates with lower expense ratios, as operational costs are spread across a larger base. It also reduces the risk of the fund being liquidated by the provider.
The Relationship Between Volume and Liquidity Explained
Liquidity is the ease with which an asset can be converted into cash without affecting its market price. While high trading volume is a strong contributor to an ETF’s liquidity, true liquidity is also determined by the underlying assets. An ETF holding highly liquid stocks (like those in the S&P 500) can be very liquid even with moderate trading volume, as market makers can easily create or redeem ETF shares by buying or selling the underlying securities.
What Propels an ETF to the Top? (The ‘Why’ Behind the Volume)
Becoming a top traded ETF is not accidental. It’s the result of a powerful combination of factors that create a self-reinforcing cycle of popularity and high trading volume.
The Power of Major Indices: The Story of SPY and QQQ
The most traded ETFs are almost always tied to the world’s most-watched benchmarks. The SPDR S&P 500 ETF (SPY) was the first ETF in the U.S. and provides direct exposure to the S&P 500, the primary gauge of U.S. large-cap equities. Similarly, the Invesco QQQ Trust (QQQ) tracks the Nasdaq-100, giving investors access to the largest non-financial, innovation-driven companies. Their popularity is self-perpetuating; as they become the default vehicles for market exposure, their volume and AUM grow, further cementing their status.
The Role of Low Expense Ratios and Performance
In the world of passive investing, cost is a critical differentiator. Issuers are in a constant battle to offer the lowest expense ratios. An ETF with a lower fee structure allows more of the investment’s returns to remain in the investor’s pocket. Over the long term, even a few basis points can make a significant difference, attracting vast sums of capital.
Impact of Sector Popularity and Market Trends
Market narratives can significantly influence trading volumes. During a tech boom, ETFs focused on technology and innovation will see a surge in activity. Likewise, in times of economic uncertainty, funds tracking safe-haven assets like gold (e.g., GLD) or government bonds often experience increased volume. These trends can propel sector-specific or thematic ETFs into the top-traded lists for certain periods.
How to Choose a Top-Traded ETF for Your Portfolio (Actionable Strategy)
Selecting the right ETF involves looking beyond the headline numbers. A high-volume ETF is not automatically the best choice for every investor. Follow this strategic process to align your choice with your financial objectives.
Step 1: Aligning with Your Investment Horizon and Risk Tolerance
First, define your goals. Are you investing for long-term growth, short-term tactical exposure, or stable income? An investor with a 30-year horizon might prefer a broad-market ETF like VTI, while a trader looking to capitalize on market volatility might use a leveraged or inverse ETF, which also feature high trading volumes.
Step 2: Looking Beyond Volume at the Underlying Holdings
Do not judge an ETF by its ticker alone. Investigate its underlying portfolio. Two ETFs tracking the same index can have minor but important differences in their construction methodology. Furthermore, ensure the ETF’s holdings match your market outlook. If you are bullish on technology, QQQ might be a fit. If you seek diversification across all sectors, an S&P 500 fund is a more balanced choice.
Step 3: Comparing Expense Ratios and Tracking Error
For long-term buy-and-hold investors, cost efficiency is paramount. Compare the expense ratios of similar ETFs. For example, SPY, IVV, and VOO all track the S&P 500, but they have different fee structures and legal setups. Also, consider the tracking error—the degree to which an ETF’s performance deviates from its benchmark index. A lower tracking error indicates a more efficient and accurate fund.
Key Takeaways for Your ETF Strategy
Investing in the most traded ETFs offers clear benefits, including superior liquidity and reduced trading costs. However, the optimal choice always hinges on your personal financial goals and investment philosophy. Use this guide to analyze the market leaders not just by their volume, but by the fundamental drivers behind their success. A thorough analysis of an ETF’s holdings, costs, and strategic fit will empower you to make an informed decision for your portfolio.
Frequently Asked Questions (FAQ)
What is the single most traded ETF right now?
Historically and consistently, the SPDR S&P 500 ETF Trust (SPY) holds the title for the most traded ETF by average daily share volume. Its immense liquidity makes it a favorite for both institutional and retail traders needing to execute large orders efficiently.
Is high trading volume always a good thing for an ETF?
Generally, yes. High volume leads to high liquidity and tight bid-ask spreads, which are beneficial for investors. However, volume alone does not guarantee a quality investment. An ETF could have high volume due to negative news or speculative trading. It’s essential to analyze the fund’s strategy, holdings, and your own goals before investing.
How can I find the daily trading volume for any ETF?
You can find daily trading volume on any major financial news website (like Bloomberg, Reuters, Yahoo Finance) or from your brokerage platform. Simply search for the ETF’s ticker symbol. For a more comprehensive view, look at the average daily volume over the past 30 or 90 days to get a better sense of its typical liquidity.