
Bitcoin has fallen a long way from grace. After soaring to nearly $126,000 in 2025, the world’s leading cryptocurrency now trades around $73,500–$74,000 as June 2026 begins — trapped in a slow-motion slide with few reasons for optimism ahead. The short answer for what happened: everything went wrong at once. Bitcoin is facing a rare convergence of institutional selling, weak on-chain activity, hostile macroeconomics, and fierce competition from other assets all hitting at the same time.

Institutions Are Walking Away
Perhaps the most alarming signal comes from the ETF market. U.S. spot Bitcoin ETFs — once celebrated as the gateway for mainstream investment — suffered one of their worst months ever in May, with net outflows reaching as high as $4 billion. BlackRock’s IBIT fund posted nine consecutive days of redemptions at one point. This isn’t just a blip. It represents a genuine pullback by the institutional investors who fueled Bitcoin’s epic 2024–2025 rally. Without their buying pressure, the floor looks increasingly soft.
On-chain data tells a similar story. Whales — large holders who can move markets — offloaded thousands of Bitcoin in recent weeks. Long-term holders trimmed their positions by nearly 8%, and overall demand readings hit their lowest levels of 2026. When even the most patient investors are selling, the crowd usually follows.
Macro Headwinds Aren’t Helping
Bitcoin was never going to thrive in a “higher-for-longer” rate environment, and that’s exactly where we are. Sticky inflation has kept the Federal Reserve from cutting rates meaningfully. U.S. Treasury yields remain elevated, making the risk-free return on bonds genuinely attractive — a sharp contrast to holding a volatile, non-yielding asset like Bitcoin. A strengthening dollar and geopolitical uncertainty are adding further pressure on risky assets across the board.
The Competition Is Fierce
Even within the broader investment universe, Bitcoin is losing the narrative war. The biggest story in markets right now is AI infrastructure. Semiconductor companies like Micron Technology have joined the trillion-dollar club, and memory chips have overtaken even Nvidia as the go-to momentum trade for speculative capital. Upcoming IPOs from OpenAI, SpaceX, and Anthropic are lining up to absorb hundreds of billions more in investor dollars.
Within crypto itself, altcoins like Solana, XRP, and Sui are drawing fresh attention. Bitcoin’s dominance is eroding as investors chase higher-beta narratives. Even gold — Bitcoin’s supposed rival as a store of value — has been pulling in competitive inflows, quietly undermining the “digital gold” pitch.

What the Charts Are Saying
Technically, the picture is equally grim. Bitcoin is stuck in a falling trend channel, trading below key moving averages, with resistance at $74,800–$75,000 proving difficult to crack. Below, the $70,000–$73,000 support zone looks fragile. A decisive break lower could send prices toward the $68,000 Fibonacci level — roughly a 7% drop from current levels. Daily and weekly momentum indicators are pointed firmly downward, with bearish patterns reinforcing the seller’s grip.
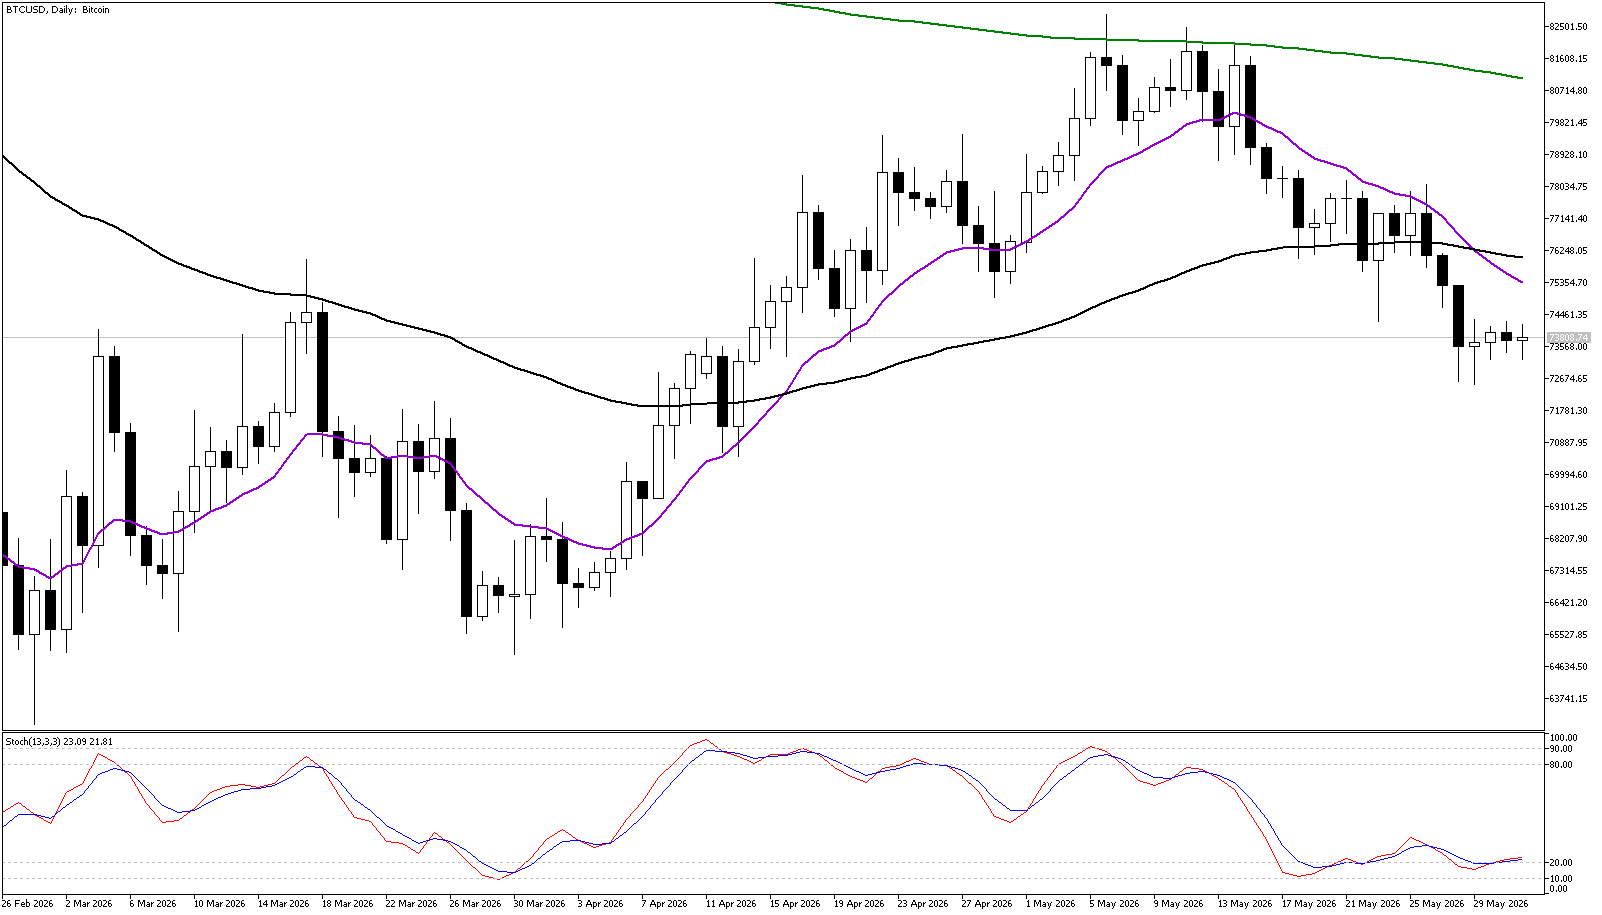
BTCUSD Daily Chart
The Monthly Outlook
The most likely scenario over the next 30 days is choppy, sideways-to-lower trading in the $70,000–$72,000 range, with the risk of deeper losses if outflows and capital rotation persist. Reclaiming $73,869 might offer temporary relief, but failing to do so would likely invite further weakness. June has historically delivered mixed results for Bitcoin, offering little seasonal help.