The Dow Jones Industrial Average closed at around 48,500 on April 14 — a number that, on the surface, suggests stability. But beneath that figure lies a convergence of pressures that market analysts have rarely seen arrive simultaneously: soaring bond yields, an unmoved Federal Reserve, and an escalating military confrontation in the Middle East. Together, these forces are quietly loading the spring on what could become one of the sharpest market corrections in recent memory.
Table of Contents
The Bond Yield Alarm That Wall Street Cannot Ignore
To understand the threat, start with a number: 4.25%. That is where the yield on the 10-year U.S. Treasury note currently sits, and it matters enormously. When government bonds — considered among the safest investments on earth — offer returns that rival or exceed the earnings yield of stocks, investors face a fundamental question: why take the risk of owning equities at all?
Wall Street has long treated 4.5% as a critical threshold. Once yields break above it, stocks historically face sharp price compression, because the mathematical models used to value companies require future earnings to be “discounted” at higher rates — making those future earnings worth less today. If the market adjusts fully to reflect the new yield environment, analysts warn that broad indices could fall by 11% or more.
A Federal Reserve That Refuses to Blink
Normally, investors would look to the Federal Reserve to ride to the rescue by cutting interest rates, easing the financial conditions that make stocks attractive. Not this time. Despite vocal pressure from political figures to reduce borrowing costs, the Fed has adopted a firm “wait and see” posture — which, in practice, means “higher for longer.”
The reason is straightforward: inflation accelerated in March, driven largely by surging energy costs. With price pressures re-igniting, the Fed has no political cover to cut. Treasury Secretary Scott Bessent has acknowledged the central bank’s caution is understandable given the circumstances. The FOMC meeting on April 28–29 is expected to deliver hawkish signals, confirming that rate cuts remain off the table well into 2026. For markets that had been banking on cheaper money to sustain high valuations, that confirmation could act as a trigger for a significant sell-off.
A Geopolitical Shock That Hit Closer Than Expected
Compounding the financial pressures is a geopolitical crisis that has escalated far faster than markets anticipated. The Dow’s brief climb above 48,000 was partly built on fragile hopes for a diplomatic breakthrough in the Middle East — hopes that have since unraveled. Should U.S.-Iran peace talks collapse entirely, the conflict risks settling into the kind of prolonged, grinding stalemate the world has witnessed with the Russia-Ukraine war: a slow bleed that keeps global energy markets on edge indefinitely. Oil prices have already responded, surging back above $100 per barrel — and that is before a worst-case scenario fully takes hold. For corporations, sustained energy costs at these levels translate directly into shrinking profit margins and mounting operational pressure. For everyday consumers, it signals that the inflation the Federal Reserve has been fighting so hard to suppress could not only persist, but intensify in the months ahead.
What the Charts Are Saying
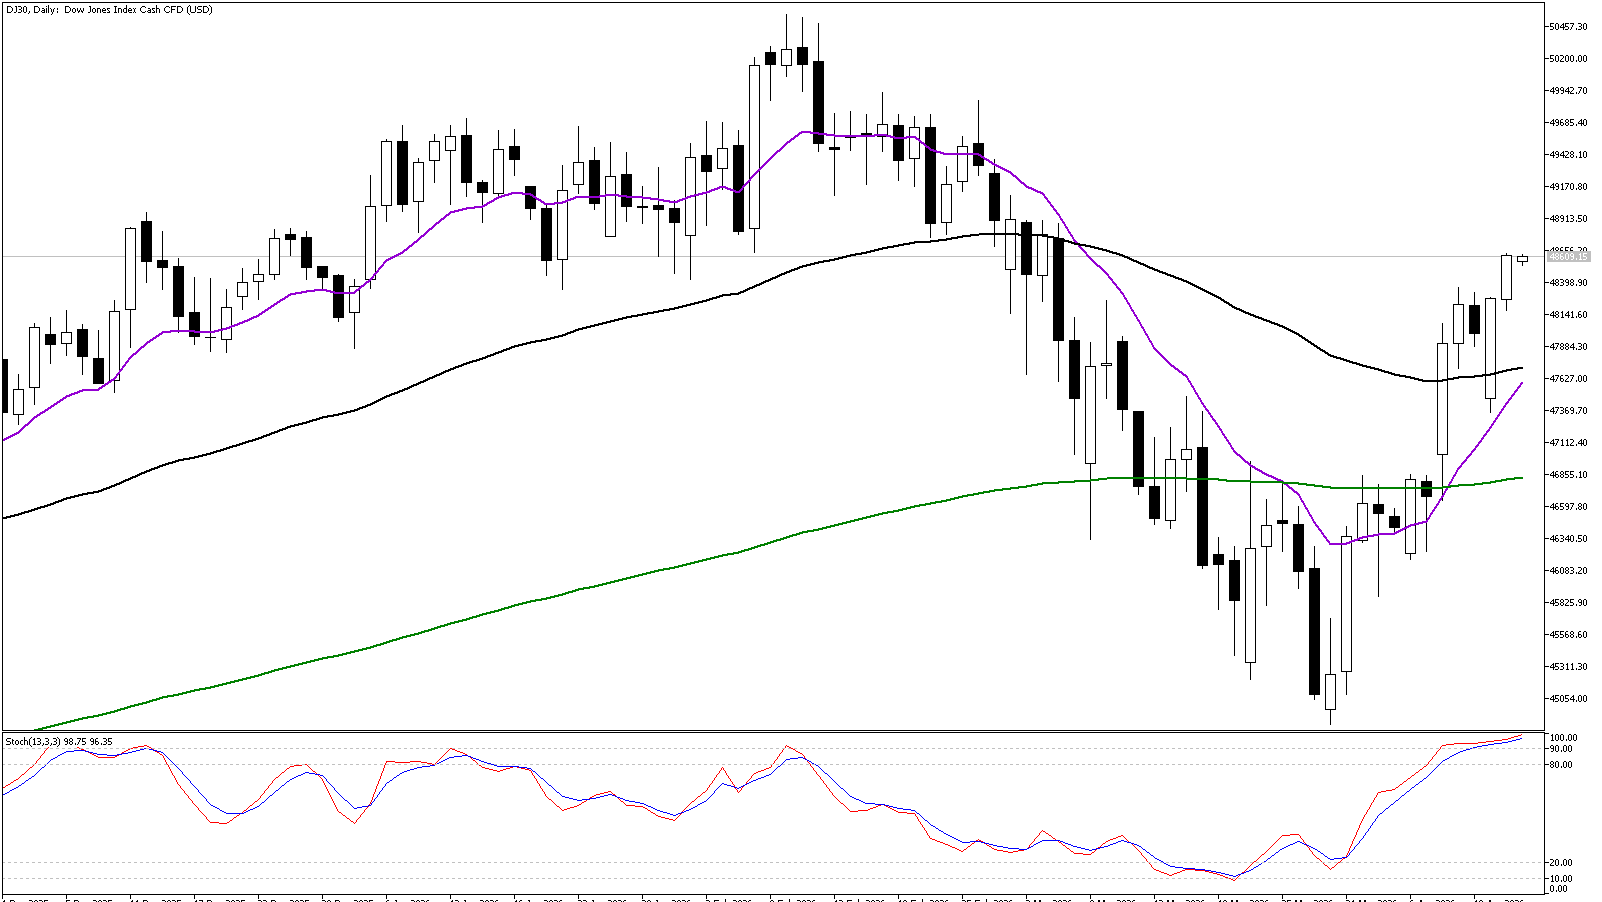
From a purely technical standpoint, the Dow is sending warning signals. The index is bumping against a resistance zone between 48,500 and 48,600 — a ceiling it has repeatedly failed to break through convincingly. Momentum indicators are flashing exhaustion, suggesting the recent relief rally has run its course.
The critical level to watch is 47,800. If the Dow falls through that floor, technical models project a rapid descent to 47,000 — and potentially as low as 45,000 in a more severe scenario. With bond markets unrelenting, the Fed on hold, inflation re-accelerating, and a naval blockade reshaping energy markets, the fundamental case for a meaningful pullback is growing harder to dismiss. The next 30 days will likely determine whether this is a temporary pause or the beginning of something much steeper.
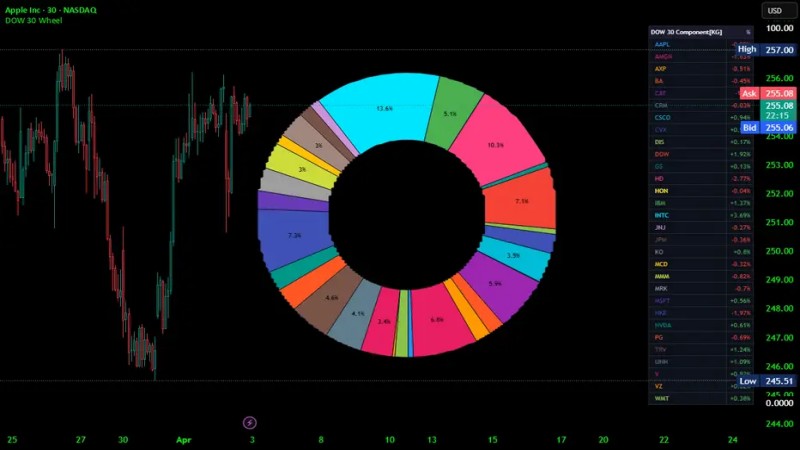
Dow Jones Index Daily Chart